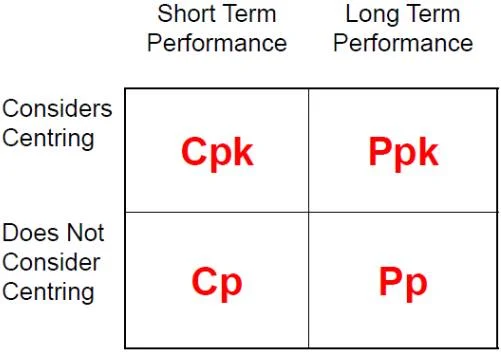
Process Capability is a measurement of a process's performance to the desired specification. It is expressed as a process capability index, Cp or Cpk (short-term processes). For long-term performance, process performance index, Pp and Ppk are used (figure 1). In this article, Cp and Cpk will be discussed.
Process Capability
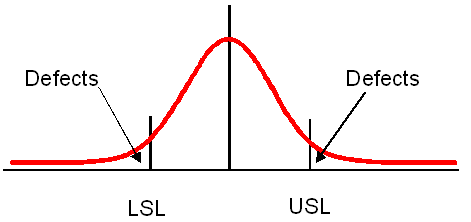
Process capability is widely used to indicate a capability of process output against customers' requirements, specifications or engineering tolerances. It can be simply illustrated by processing process mean and standard deviation to a required outcome target with given torelance, Lower Spec Limit (LSL) and Upper Spec Limit (USL). For instance, in figure 2, the red line is a distribution of outcomes of the process and the black bold line is the mean (average) of distribution. Anything displayed beyond the LSL and USL is considered as defects which would be rejected against the target specification.
Definition of Cp and Cpk
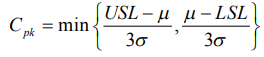
Cp and Cpk are defined as below [3]:
Cp = Process Capability. A simple and straightforward indicator of process capability
Cp = (USL-LSL) / (6σ) ··· (σ: distribution, standard deviation)
Cpk = Adjustment of Cp for the effect of non-centred distribution.
Cpk = (1-k)Cp ··· (k:katayori, shift in Japanese)
or
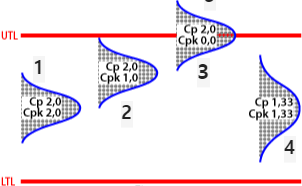
In practice, Cpk is more widely used than Cp because Cp only considers variation, not an average value to the target value. In figure 4, the first three graphs have the same Cp size, 2, however, it doesn't mean they are all within the customer's requirements. For example, Cp sizes are exact for 1-3 curves, however having different Cpk sizes. It is because Cp doesn't count where the variation is located, but only expresses how widely the output is spread.
Six Sigma Level
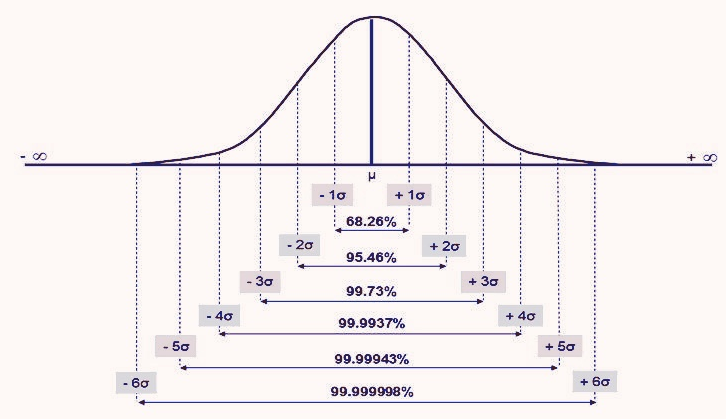
Six Sigma was developed to overcome product failures by minimizing defects from the manufacturing process and delivering result-oriented quality to make customers satisfied [5]. Six sigma has six levels from 1 to 6 which indicates a better process outcome as the level is increased (figure 4).
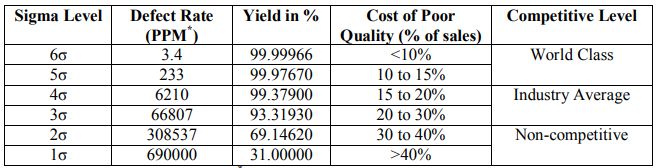
In table 1, 6σ has a 3.4 defect rate which means a defect of 3.4 parts per million (PPM).
How to read Cp and Cpk based on Sigma Level
Six Sigma (6σ) level is used to explain process capability value. For example, from figure 3, various Cps and Cpks are calculated, but it is hard to understand the meaning of values. Here, the Six Sigma level plays.
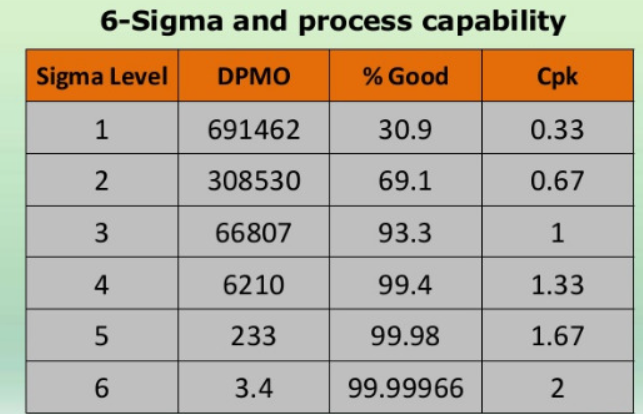
When Cpk is 1.0, the process has 66807 defects per million opportunities (DPMO) which lie within Sigma level 3. Therefore its process yield is 93.3. Generally, Sigma level 4 is considered as industry average (table 1), thus Cpk 1.33 is used to evaluate a process capability. When Cpk is below 1.33, the process is assessed as not having enough industrial standard capability, but capable to operate. On the other hand, if Cpk is below 0.33 which indicates Sigma level 1, the overall process quality is significantly poor and the whole process needs to be re-assessed.
Conclusion
Process Capability Indices, Cp and Cpk are great tools to evaluate a process capability against given limits by customers. However, Cp and Cpk values are not always meaningful. As mentioned, Cp only counts the width of distribution but does not consider the centre of the process on the target value. Cpk is better as it takes into account the location of the curve, but if the process is out of control (unstable), the Cpk value is questionable. When a process is not stable, it is less predictable [9]. Additionally, even if the Cpk value is higher on an unstable process, does it mean the process can be valued as a better process compare to a controlled process with a low Cpk value?
Process Capability Index can not be a magic indicator to evaluate every process, but it is useful to discuss with customers if a process is capable without question.
[Reference]
[1]"DongDong style : 네이버 블로그", Blog.naver.com, 2020. [Online]. Available: https://blog.naver.com/qjdlgo1/222180629579. [Accessed: 07- Aug- 2022].
[2]A. Muir, "CALCULATING PROCESS EFFICIENCY IN TRANSACTIONAL PROJECTS", ISIXSIGMA. [Online]. Available: https://www.isixsigma.com/tools-templates/capability-indices-process-capability/calculating-process-efficiency-transactional-projects/. [Accessed: 07- Aug- 2022].
[3]"PROCESS CAPABILITY (CP, CPK) AND PROCESS PERFORMANCE (PP, PPK) – WHAT IS THE DIFFERENCE?". [Online]. Available: https://www.isixsigma.com/tools-templates/capability-indices-process-capability/process-capability-cp-cpk-and-process-performance-pp-ppk-what-difference/. [Accessed: 07- Aug- 2022].
[4]"Cp, Cpk, Cm, Cmk, control limits", Statistical Process Control. [Online]. Available: https://www.statisticalprocesscontrol.info/glossary.html. [Accessed: 07- Aug- 2022].
[5]K. Vimal, The Performances of Process Capability Indices in the Six-Sigma Competitiveness Levels. 2018.
[6]F. Gracias, "Six Sigma - Remote Software Solutions Pvt Ltd", Remote Software Solutions Pvt Ltd. [Online]. Available: https://www.remotesoftwaresolutions.com/2018/12/six-sigma/. [Accessed: 14- Aug- 2022].
[7]H. M.J, "Six sigma: a breakthrough strategy for profitability", Quality Progress, vol. 31, no. 5, pp. 60-64, 1998. [Accessed 14 August 2022].
[8]M. M.S, “Statistical Quality Control. Delhi: Dhanpat Rai & Co. (P) Ltd, Educational & Technical Publishers, 2008, p. Chapter 17.
[9]M. Savage, "Should you calculate Cpk when your process is not in control?", PQ Systems. [Online]. Available: https://www.pqsystems.com/qualityadvisor/DataAnalysisTools/capability_cpk_when_not_in_control.php. [Accessed: 14- Aug- 2022].
'Technology > Manufacturing Engineering' 카테고리의 다른 글
| Failure Mode and Effects Analysis (FMEA) (0) | 2022.03.22 |
|---|---|
| Lean Manufacturing (0) | 2022.01.13 |
| Six Types of Manufacturing Process (0) | 2022.01.08 |
| List of Manufacturing Process (0) | 2022.01.06 |


